
By Justin Faust, Principal Software Development Engineer
Monitoring computer systems is essential for maintaining the performance and reliability of a system. In today's digital age, the consequences of system failure or malfunction can be catastrophic for individuals and businesses alike. Monitoring tools such as Prometheus and Grafana can provide valuable insights into the health of a system, enabling users to identify potential issues before they become major problems. This blog post will serve as a beginner's guide to monitoring computer systems, discussing why it is important, which industries it is particularly relevant for, and how Prometheus and Grafana can be used to monitor your system. For a more in-depth discussion of monitoring, check out our white paper, "Monitoring Edge Systems with U-BMC" and the source code.
Monitoring is relevant to any industry where the performance and reliability of systems are critical to business operations. This includes industries such as finance, healthcare, and e-commerce. In these industries, hardware failure or malfunction can lead to significant financial losses, reputational damage, and even legal liability. Monitoring computer system hardware is crucial for identifying potential issues before they become major problems. Without monitoring, issues such as data loss or system downtime may go unnoticed, leading to costly consequences.
Monitoring can help improve a system's overall performance by providing insights into its health and identifying areas for optimization. In a previous blog post, we discussed the benefits of out-of-band management using the Redfish API (Application Program Interface) implemented by our Unified-BMC (U-BMC). By leveraging Redfish, our customers can gain secure and efficient access metrics even when the system is not connected to the internet. Employing monitoring tools enables real-time insights to any number of decentralized systems. These systems can be counted in the thousands. Monitoring these systems can be a daunting task, but with the right tools, it can be done efficiently and effectively.
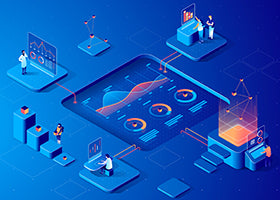
Prometheus and Grafana are popular open-source monitoring tools that can be used for collecting a wide range of metrics. Prometheus is a monitoring solution that collects metrics from various sources, such as systems, applications, and databases. It stores the collected data in a time-series database, making it easy to query and analyze. With Prometheus, we can collect metrics from the various sources available to us, including JSON APIs like our Redfish implementation on U-BMC. Grafana is a visualization tool that can be used to create dashboards to display the collected data in a visually appealing and easy-to-understand way. Grafana lets us customize the dashboards according to our needs by displaying metrics in various formats, such as tables, graphs, and maps.
When monitoring your system, it is important to track a range of metrics to gain a comprehensive understanding of the health of the system. External workload of customers and their demand should be tracked as it can help businesses understand their customer's needs better. Internal system metrics such as CPU, memory, networking, and processes should also be monitored to identify potential issues and optimize system performance. You may find it helpful to apply the USE Method as "... it directs the construction of a checklist, which for server analysis can be used for quickly identifying resource bottlenecks or errors." Read more about it here: https://www.brendangregg.com/usemethod.html.
Prometheus and Grafana can be used to gather these metrics and help us gain valuable insights into the health of a system. To get started using Prometheus and Grafana, follow these steps:
Gathering metrics and visualizing them in Grafana dashboards has the potential to aid you in finding issues such as CPU overload or high memory usage. For example, if a system is experiencing high CPU usage, it may indicate that the system is running too many processes or that the CPU is not powerful enough to handle the workload. This condition will be made obvious by the monitoring software, and we can create alerts if the average CPU usage remains too high over a long range in time. By identifying this issue early, steps can be taken to optimize the system's performance and prevent further issues from occurring.
Prometheus and Grafana are powerful tools that can be used to monitor a wide range of metrics, enabling users to identify potential issues before they become major problems. By implementing monitoring practices using these tools, businesses can prevent costly consequences and improve efficiency in their operations.
At One Stop Systems, we believe that collaboration and partnerships are essential to solving tough issues in the computing industry. We invite businesses to collaborate with us to develop innovative solutions that address their unique challenges. If you are looking for a partner to help you tackle the challenges of monitoring your edge systems, reach out to us today. Let’s work together to keep your systems running smoothly and efficiently.
Click the buttons below to share this blog post!


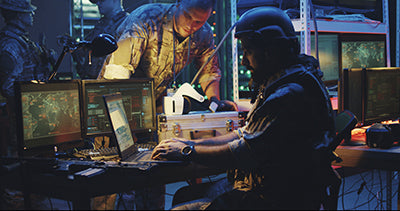
Watching the conflicts play out recently in the Ukraine and Iran, it is certain that there has been not only massive adoption in implementation of AI, sensor processing, sensor fusion, and autonomy but also massive advancement of those technologies in relatively short time periods compared to any other time in history. The leaders on the battlefield are those that have harnessed and deployed these technologies without delay in alignment to standards, timing, or bureaucracy in acquiring. Because the level and pace of technology today is so steep, those who fail to adopt and move with a sense of urgency run the risk of falling behind in a technology battle from which they may never have the time or ability to catch up.


Before starting college in 2022, I had considered artificial intelligence (AI) a thing of the future, something I wouldn’t see until I was later in my years. With the birth of large language models (LLMs) like ChatGPT and the rise of machine learning systems, my world flipped on its head. Since joining the tech industry, I see I am not alone with this experience. From one year to the next, there is no telling what kind of technological developments we will bear witness to. When it comes to the defense and security of our nation, capitalizing on these advancements is paramount, lest we fall behind our adversaries. As a result, within the defense industry, marketers are required to become adaptable to the shifting needs of their company’s customers.
Get the latest news, product releases, upcoming events, blog posts and more!

